
Custom Executive Dashboards
Custom Dashboard Development
Stop making critical business decisions based on outdated spreadsheets. We build secure, custom dashboards that pull your scattered data into one clear, real-time view.
Flying blind is a risk you cannot afford. When your financial, operational, and sales data are trapped in half a dozen different software platforms, your leadership team wastes hours just trying to piece together a basic performance report. We solve this data fragmentation. Our team builds custom web dashboards that connect directly to your existing tools. We pull the exact metrics you care about into a single, intuitive screen so you can stop guessing and start making confident, data-backed decisions.
The End of Data Silos
Your CRM says one thing, your accounting software says another, and your warehouse team is tracking inventory on a clipboard.
We eliminate this confusion by acting as the bridge between your disconnected systems.
We build secure data pipelines that pull raw information from all your different platforms into a single and reliable source of truth.
No more conflicting reports or arguing over which spreadsheet has the correct numbers during your Monday morning meetings.


Tracking the KPIs That Actually Matter
Most dashboards fail because they track too much.
Giving your leadership team a screen full of fifty different charts creates paralysis, not clarity.
We focus strictly on the Key Performance Indicators (KPIs) that actually drive your business forward.
Whether you need to monitor customer acquisition cost, monthly recurring revenue, or supply chain velocity, we cut out the vanity metrics.
We build clean, focused views that tell you exactly whether you are winning or losing today, so you can make confident decisions tomorrow.


Role-Specific and Custom Interfaces
Out-of-the-box reporting tools force you to look at generic graphs that do not actually reflect your unique business model.
Furthermore, your CEO needs a very different view than your warehouse manager.
We design the interface around the specific people using it.
We strip away the visual clutter and highlight exactly what each leader needs to see to do their job effectively, ensuring the dashboard actually gets used daily instead of ignored.
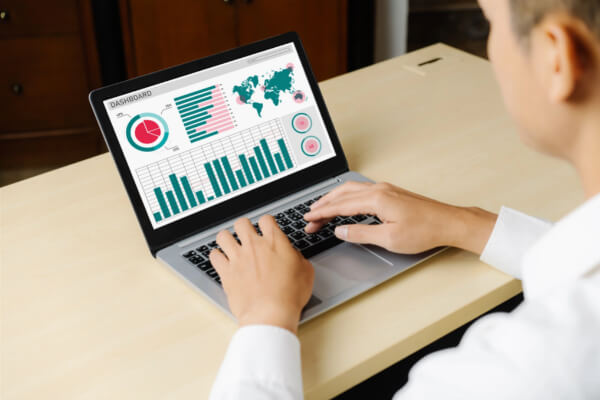

We Build Dashboard Solutions With
We do not force a single software on you. We select the right analytical tools and programming languages to securely process your data and build the exact dashboard your team needs:

PowerBI
For building deeply integrated, enterprise-grade dashboards that securely connect massive datasets and integrate seamlessly with your existing Microsoft infrastructure.

Google Data Studio
For deploying fast highly visual, and easily shareable dashboards that perfectly track your real-time marketing, sales, and web performance.

Python
For engineering the heavy data pipelines behind the scenes. We use it to securely fetch, clean, and organize your raw data from scattered APIs before it ever hits your dashboard.

R Programming
For integrating advanced statistical computing and predictive modeling directly into your reporting, allowing you to forecast trends and analyze complex business data with absolute precision.
Why should we build your dashboard
Does this sound familiar?
Your leadership team spends the first week of every month waiting for department heads to manually compile performance reports.
You have meetings where two managers bring different numbers for the exact same metric, leading to arguments over whose data is right.
You are paying for an expensive analytics tool, but it is so complicated and cluttered that no one on your team actually uses it.
You know there are bottlenecks in your operations, but your data is so scattered you cannot pinpoint exactly where they are occurring.
FAQ
Frequently Asked Questions
How it works
We Get You Involved in Each Development Step
See exactly how your data flows from scattered systems into a unified dashboard without getting bogged down in the technical jargon.
KPI Mapping & Discovery
We sit down with your leadership to define exactly which metrics actually drive your business, ignoring the vanity data that just causes dashboard clutter.
Data Source Auditing
We look at where your data currently lives, whether it is an old ERP, a modern CRM, or complex Excel files, and map out the most secure connections.
Wireframing the Interface
We draft exactly how the dashboard will look. You get to approve the layout and charts before we write any code to ensure it makes total sense to your team.
Pipeline & Agile Development
We build the secure data pipelines in the background to fetch your metrics, and construct the visual front-end, connecting your live data to the new interface.
Quality Assurance & Testing
We run the dashboard parallel to your old reporting methods to verify that every single number matches perfectly and the system handles heavy data loads without lag.
Launch & Role-Based Access
We push the dashboard live, set up secure, role-based logins for your team, and ensure everyone knows how to use their new central command hub.